‘What Do You Mean, It Was a False Positive?’ Making Sense of COVID-19 Tests and Terminology

Priyanka Gogna, a PhD Candidate in Epidemiology at Queen's University in Ontario, explains the importance of looking at sensitivity and specificity to understanding COVID-19 data. Photo: Chris McGrath/Getty Images
During the COVID-19 pandemic, words and phrases that have typically been limited to epidemiologists and public health professionals have entered the public sphere. Although we’ve rapidly accepted epidemiology-based news, the public hasn’t been given the chance to fully absorb what all these terms really mean.
As with all disease tests, a false positive result on a COVID-19 test can cause undue stress on individuals as they try to navigate their diagnosis, take days off work and isolate from family. One high-profile example was Ohio Governor Mike DeWine whose false positive result led him to cancel a meeting with President Donald Trump.
False negative test results are even more dangerous, as people may think it is safe and appropriate for them to engage in social activities. Of course, factors such as the type of test, whether the individual had symptoms before being tested and the timing of the test can also impact how well the test predicts whether someone is infected.
In the epidemiological context, sensitivity is the proportion of true positives that are correctly identified. If 100 people have a disease, and the test identifies 90 of these people as having the disease, the sensitivity of the test is 90 per cent.
Specificity is the ability of a test to correctly identify those without the disease. If 100 people don’t have the disease, and the test correctly identifies 90 people as disease-free, the test has a specificity of 90 per cent.
This simple table helps outline how sensitivity and specificity are calculated when the prevalence — the percentage of the population that actually has the disease — is 25 per cent (totals in bold):
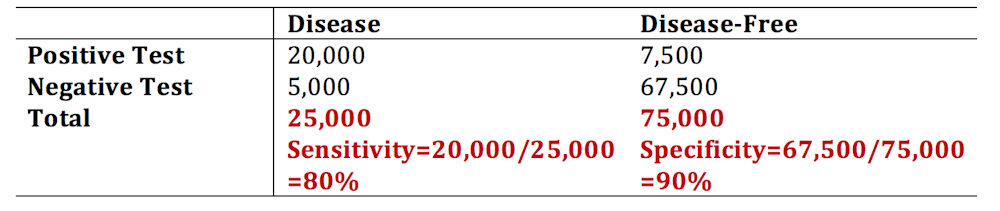
A test sensitivity of 80 per cent can seem great for a newly released test (like for the made-up case numbers I reported above).
Predictive Value
But these numbers don’t convey the whole message. The usefulness of a test in a population is not determined by its sensitivity and specificity. When we use sensitivity and specificity, we are figuring out how well a test works when we already know which people do, and don’t, have the disease.
But the true value of a test in a real-world setting comes from its ability to correctly predict who is infected and who is not. This makes sense because in a real-world setting, we don’t know who truly has the disease — we rely on the test itself to tell us. We use the positive predictive value and negative predictive value of a test to summarize that test’s predictive ability.
To drive the point home, think about this: in a population in which no one has the disease, even a test that is terrible at detecting anyone with the disease will appear to work great. It will “correctly” identify most people as not having the disease. This has more to do with how many people have the disease in a population (prevalence) rather than how well the test works.
Using the same numbers as above, we can estimate the positive predictive value (PPV) and negative predictive value (NPV), but this time we focus on the row totals (in bold).
The PPV is calculated as the number of true positives divided by the total number of people identified as positive by the test.
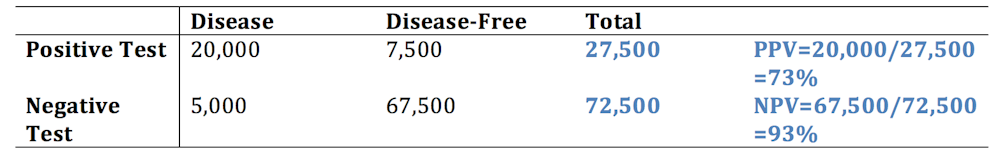
The PPV is interpreted as the probability that someone that has tested positive actually has the disease. The NPV is the probability that someone that tested negative does not have the disease. Although sensitivity and specificity do not change as the proportion of diseased individuals changes in a population, the PPV and NPV are heavily dependent on the prevalence.
Let’s see what happens when we redraw our disease table when the population prevalence sits at one per cent instead of 25 per cent (much closer to the true prevalence of COVID-19 in Canada).
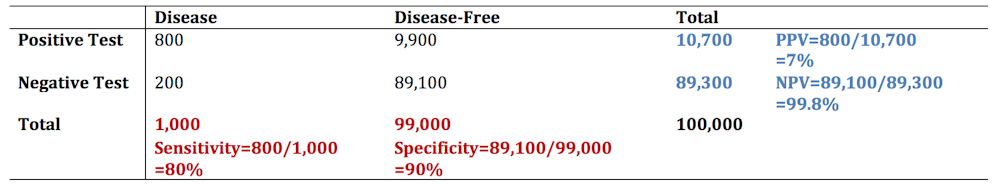
So, when the disease has low prevalence, the PPV of the test can be very low. This means that the probability that someone that tested positive actually has COVID-19 is low. Of course, depending on the sensitivity, specificity and the prevalence in the population, the reverse can be true as well: someone that tested negative might not truly be disease-free.
False Positive and False Negative Tests in Real Life
What does this mean as mass testing begins for COVID-19? At the very least it means the public should have clear information about the implications of false positives. All individuals should be aware of the possibility of a false positive or false negative test, especially as we move to a heavier reliance on testing this fall to inform our actions and decisions. As we can see using some simple tables and math above, the PPV and NPV can be limiting even in the face of a “good” test with high sensitivity and specificity.
Without adequate understanding of the science behind testing and why false positives and false negatives happen, we might drive the public to further mistrust — and even question the usefulness — of public health and testing. Knowledge is power in this pandemic.![]()
Priyanka Gogna is a PhD Candidate in Epidemiology at Queen’s University, Ontario.
This article is republished from The Conversation under a Creative Commons license.
RELATED:
Meet the Super Centenarians Who Beat COVID-19
Trudeau Announces Pharma Deals To Supply 100 Million Doses of Potential COVID-19 Vaccine
Canada’s Hidden Shame: How COVID-19 Exposed Years of Systemic Neglect in Long-Term Care
'%3E %3Cg id='Group'%3E %3Cpath id='Vector_2' d='M12.4876 13.8996V13.4213H0.743091V15.2149H9.18805L9.22196 15.2685C9.19653 15.2272 3.24373 25.2836 0.74521 29.5469C0.420975 30.1015 0.0797856 30.7158 0.0797856 30.7158C0.0713089 30.7323 0.0585938 30.755 0.0585938 30.755H12.1401V28.9614H3.67181L3.6379 28.9078C3.37512 29.1222 12.4876 13.8996 12.4876 13.8996ZM36.1229 22.115C36.1229 26.4896 33.7537 29.18 31.1683 29.18C28.5829 29.18 26.1861 26.4896 26.1861 22.115C26.1861 17.7403 28.5553 15.0231 31.1683 15.0231C33.7812 15.0231 36.1229 17.7403 36.1229 22.115ZM22.0155 22.115C22.0155 26.4896 19.6462 29.18 17.0587 29.18C14.4712 29.18 12.0765 26.4896 12.0765 22.115C12.0765 17.7403 14.4458 15.0231 17.0587 15.0231C19.6717 15.0231 22.0155 17.7403 22.0155 22.115ZM38.223 22.0613C38.223 16.7095 35.0443 13.1492 31.1661 13.1492C27.288 13.1492 24.3402 16.4312 24.0987 21.4326C23.8592 16.4333 20.7842 13.1492 17.0587 13.1492C13.3332 13.1492 9.97427 16.7074 9.97427 22.0613C9.97427 27.4153 13.1785 31.0003 17.0587 31.0003C20.9389 31.0003 23.8592 27.7183 24.0987 22.6922C24.3402 27.7162 27.4406 31.0003 31.1661 31.0003C34.8917 31.0003 38.223 27.4421 38.223 22.0613ZM51.3747 30.755H53.5257L52.3178 13.4213H50.1668L45.797 27.3328L41.4273 13.4213H39.2763L38.0662 30.755H40.2172L41.0352 19.0247L44.7205 30.755H46.8714L50.5567 19.0247L51.3747 30.755ZM53.9453 30.755H62.3797V28.9614H56.0963V22.9293H60.964V21.1357H56.0963V15.2128H61.8859V13.4192H53.9453V30.7529V30.755ZM69.3624 18.2021C69.3624 20.1029 68.1333 21.1625 66.7367 21.1625H64.893V15.2128H66.7092C68.1333 15.2128 69.3624 16.3261 69.3624 18.2021ZM71.5134 18.1753C71.5134 15.2128 69.3348 13.4213 67.0164 13.4213H62.7993V30.755H64.893V22.9313H66.7092L71.5112 30.755H73.997L68.8601 22.4695C70.369 21.8717 71.5134 20.3502 71.5134 18.1773' fill='%23231F20'/%3E %3C/g%3E %3C/g%3E %3C/g%3E %3Cg id='Group_2'%3E %3Cpath id='Vector_3' d='M9.67285 8.56629V3.50513H12.6249V4.11535H10.5947V5.71719H12.2943V6.32742H10.5947V7.954H12.9046V8.56423H9.67285V8.56629Z' fill='%23231F20'/%3E %3Cpath id='Vector_4' d='M17.6819 8.6137H17.2581L15.1855 3.50513H16.1392L17.0822 5.86975C17.2178 6.20991 17.362 6.63872 17.4976 7.05103H17.5188C17.6544 6.64696 17.7879 6.2264 17.9341 5.86975L18.8666 3.50513H19.7482L17.6862 8.6137H17.6819Z' fill='%23231F20'/%3E %3Cpath id='Vector_5' d='M22.4072 8.56629V3.50513H25.3593V4.11535H23.3291V5.71719H25.0287V6.32742H23.3291V7.954H25.639V8.56423H22.4072V8.56629Z' fill='%23231F20'/%3E %3Cpath id='Vector_6' d='M31.6164 8.56629L29.9698 6.32123H29.2959V8.56629H28.374V3.50513H30.0948C30.9552 3.50513 31.805 4.01227 31.805 4.90906C31.805 5.54402 31.3896 5.97283 30.8725 6.16249L32.6654 8.56629H31.6185H31.6164ZM29.9592 4.10711H29.2959V5.71719H29.9592C30.436 5.71719 30.8704 5.43888 30.8704 4.90906C30.8704 4.37923 30.436 4.10711 29.9592 4.10711Z' fill='%23231F20'/%3E %3Cpath id='Vector_7' d='M37.5849 6.27382V8.56629H36.6737V6.28206L34.6943 3.50513H35.667L36.6503 4.90081C36.8156 5.13789 37.0021 5.38528 37.1378 5.59968H37.159C37.3031 5.39353 37.5001 5.11522 37.657 4.90081L38.6403 3.50513H39.5621L37.5828 6.27382H37.5849Z' fill='%23231F20'/%3E %3Cpath id='Vector_8' d='M44.3084 4.11535V8.56629H43.376V4.11535H41.7188V3.50513H45.9656V4.11535H44.3084Z' fill='%23231F20'/%3E %3Cpath id='Vector_9' d='M52.0484 8.56629V6.32948H49.499V8.56629H48.5771V3.50513H49.499V5.71926H52.0484V3.50513H52.9808V8.56629H52.0484Z' fill='%23231F20'/%3E %3Cpath id='Vector_10' d='M56.2129 8.56629V3.50513H57.1453V8.56629H56.2129Z' fill='%23231F20'/%3E %3Cpath id='Vector_11' d='M64.7402 8.64463L62.4091 6.17693C62.0467 5.79553 61.6208 5.31106 61.2796 4.91524L61.2584 4.92349C61.2796 5.3523 61.2902 5.7811 61.2902 6.13776V8.56629H60.3789V3.50513H61.0316L63.1868 5.82233C63.4878 6.14806 63.9222 6.63872 64.2337 7.00362L64.2549 6.99537C64.2337 6.62223 64.2231 6.17899 64.2231 5.83677V3.50513H65.1344V8.64669H64.7402V8.64463Z' fill='%23231F20'/%3E %3Cpath id='Vector_12' d='M70.9048 8.64416C69.4235 8.64416 68.0566 7.69172 68.0566 6.03421C68.0566 4.37671 69.4659 3.41602 70.8752 3.41602C71.5999 3.41602 72.17 3.57476 72.5324 3.78091L72.3883 4.42412C72.0471 4.21797 71.5491 4.05098 71.0002 4.05098C69.9639 4.05098 68.9912 4.77253 68.9912 6.04246C68.9912 7.31239 69.9448 8.01745 70.9599 8.01745C71.405 8.01745 71.7567 7.93911 71.975 7.7948V6.61352H70.8349V6.03421H72.8354V8.12877C72.3586 8.47718 71.7271 8.64416 70.9091 8.64416H70.9048Z' fill='%23231F20'/%3E %3C/g%3E %3Cpath id='Vector_13' d='M0.0839844 1.00212L73.997 1' stroke='%23231F20' stroke-width='1.25' stroke-miterlimit='10'/%3E %3Cpath id='Vector_14' d='M0.0839844 10.9116H73.997' stroke='%23231F20' stroke-width='1.25' stroke-miterlimit='10'/%3E %3Cpath id='Vector_15' d='M4.91016 4.15649L3.55812 4.13794L5.18777 5.7068L0 5.6532V6.5974L5.20049 6.651L3.61321 8.18068L4.96526 8.19718L7.0018 6.20157L4.91016 4.15649Z' fill='%23D71920'/%3E %3C/g%3E %3C/svg%3E)
