
It’s great to have an all-stock portfolio when markets are booming. It’s not so much fun when shares plummet in value, as they did last week.
I started this Aggressive TFSA Portfolio in March 2012 for readers of my Internet Wealth Builder newsletter. I stressed at the time, and since, that it is only suitable for readers who want to maximize capital gains in a Tax-Free Savings Account through 100% exposure to domestic and international stocks. That means you should only invest in it if you are willing to accept a higher degree of risk and volatility.
This month has been a testing time for portfolios like this, with stock markets displaying increased volatility. But let’s see how it has done over the longer term, since my last review in March. Here’s a look at the securities in the portfolio with some comments on how they have fared since then. Results are as of the close of trading on Oct. 11.
iShares Core S&P/TSX Capped Composite Index ETF (TSX: XIC). This ETF tracks the performance of the S&P/TSX Composite Index. Despite the weak performance of the TSX this year, we were showing a modest capital gain over the latest period until the market started to tumble last Wednesday. As of the close on Oct. 11, the units were down $0.34 for the review period. However, due to timing, we received three quarterly distributions totalling $0.579 during that time, so we actually ended up with a small gain.
iShares S&P/TSX Small Cap Index ETF (TSX: XCS). Small cap stocks in Canada have not done well in recent years and the performance of this ETF reflects that. We lost $0.60 per unit in the period. That was only partially offset by distributions totaling $0.292 per unit.
iShares U.S. Small Cap Index ETF (CAD-Hedged) (TSX: XSU). U.S. small caps have fared much better than their Canadian counterparts. We didn’t gain any ground in the latest period but we didn’t lose much either. The units were down by $0.18 but that was almost compensated for by a June distribution of $0.156 per unit.
iShares Core S&P 500 Index ETF (CAD-Hedged) (TSX: XSP). We were cruising along very nicely with this one until last week’s big sell-off. Despite that, we’re still up $0.84 since the last review, and we received a semi-annual distribution in June of $0.228 per unit.
BMO Nasdaq 100 Equity Hedged to CAD Index ETF (TSX: ZQQ). This fund provides exposure to the top 100 stocks on the Nasdaq exchange, which is heavily weighted to technology. This ETF was going gangbusters until last week’s sell-off hit the tech sector hard. The units were trading as high as $58.40 on Oct. 1; by Oct. 11 they were down to $52.80. However, that was still an advance of $1.99 over the price at the last review. This fund only makes distributions in December, so we did not receive any cash flow in the latest period.
iShares MSCI EAFE Index ETF (CAD-Hedged) (TSX: XIN). This ETF tracks markets in Europe, Asia, and the Far East. The units are down $0.20 since the last review, but we received a semi-annual distribution of $0.38 per unit in June, so we actually came out marginally ahead.
iShares MSCI Frontier 100 ETF (NYSE: FM). This ETF tracks major companies in Third World countries from Nigeria to Vietnam. We saw some recovery in this sector last year but 2018 has been a rough time for frontier and emerging markets. We lost US$6.97 per unit during the period. There was a mid-year distribution of US$0.8052 but that came nowhere near compensating for the price drop.
iShares MSCI Emerging Markets ETF (NYSE: EEM). Rising interest rates, trade war fears, and a strong U.S. dollar ended the good run emerging markets had enjoyed. The units posted a loss of US$8.52 in the latest period. We received a mid-year distribution of US$0.2898 per unit.
We received $8.74 in interest from the cash balance in our EQ Bank high-interest savings account.
Here’s a look at how the portfolio stood at the close of trading on Oct. 11. The Canadian and U.S. dollars are treated at par, and commissions are not taken into account. The percentage in the Gain/Loss column represents the cumulative return since the portfolio was launched or since the security was added. The initial book value was $20,002.30.
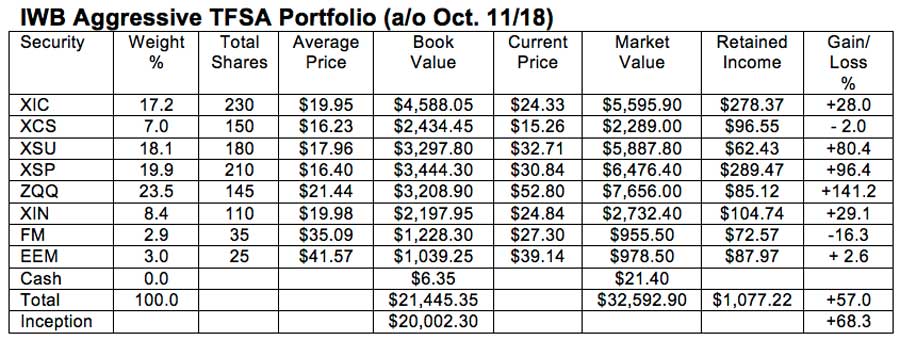
Comments: Despite the market sell-off we eked out a fractional gain of 0.3% in the latest period. There’s nothing exciting about that except that even with the market stumble we didn’t lose any ground. Of course, if the downtrend should continue this portfolio would be exposed to heavy losses.
Since inception, the portfolio has gained 68.3%, which works out to a compound annual rate of return of 8.34%.
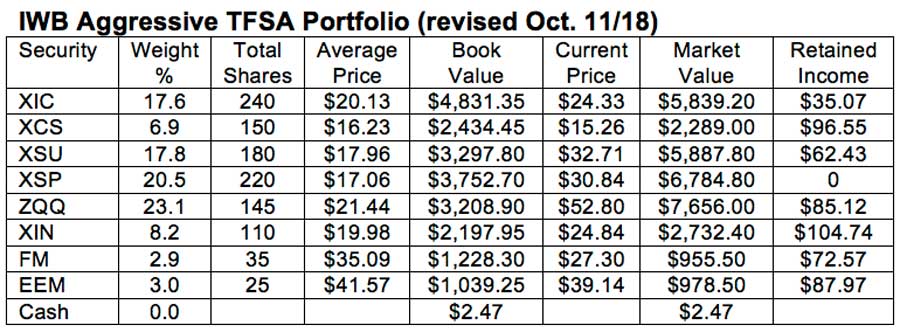
We will invest $243.30 to buy 10 additional units of XIC, to take advantage of the price weakness. That will give us 240 units and reduce the retained income to $35.07.
We’ll also buy another 10 units of XSP for $308.40, for a new total of 220. That will use all the retained earnings in the account. We will take the balance of $18.93 from cash, leaving $2.47.
We have $546.92 in cash and retained earnings, which we will continue to keep in our EQ Bank account at 2.3%.
Here is the revised portfolio. I will revisit it in March.

Gordon Pape is Editor and Publisher of the Internet Wealth Builder and Income Investor newsletters. For more information and details on how to subscribe, go to www.buildingwealth.ca.
'%3E %3Cg id='Group'%3E %3Cpath id='Vector_2' d='M12.4876 13.8996V13.4213H0.743091V15.2149H9.18805L9.22196 15.2685C9.19653 15.2272 3.24373 25.2836 0.74521 29.5469C0.420975 30.1015 0.0797856 30.7158 0.0797856 30.7158C0.0713089 30.7323 0.0585938 30.755 0.0585938 30.755H12.1401V28.9614H3.67181L3.6379 28.9078C3.37512 29.1222 12.4876 13.8996 12.4876 13.8996ZM36.1229 22.115C36.1229 26.4896 33.7537 29.18 31.1683 29.18C28.5829 29.18 26.1861 26.4896 26.1861 22.115C26.1861 17.7403 28.5553 15.0231 31.1683 15.0231C33.7812 15.0231 36.1229 17.7403 36.1229 22.115ZM22.0155 22.115C22.0155 26.4896 19.6462 29.18 17.0587 29.18C14.4712 29.18 12.0765 26.4896 12.0765 22.115C12.0765 17.7403 14.4458 15.0231 17.0587 15.0231C19.6717 15.0231 22.0155 17.7403 22.0155 22.115ZM38.223 22.0613C38.223 16.7095 35.0443 13.1492 31.1661 13.1492C27.288 13.1492 24.3402 16.4312 24.0987 21.4326C23.8592 16.4333 20.7842 13.1492 17.0587 13.1492C13.3332 13.1492 9.97427 16.7074 9.97427 22.0613C9.97427 27.4153 13.1785 31.0003 17.0587 31.0003C20.9389 31.0003 23.8592 27.7183 24.0987 22.6922C24.3402 27.7162 27.4406 31.0003 31.1661 31.0003C34.8917 31.0003 38.223 27.4421 38.223 22.0613ZM51.3747 30.755H53.5257L52.3178 13.4213H50.1668L45.797 27.3328L41.4273 13.4213H39.2763L38.0662 30.755H40.2172L41.0352 19.0247L44.7205 30.755H46.8714L50.5567 19.0247L51.3747 30.755ZM53.9453 30.755H62.3797V28.9614H56.0963V22.9293H60.964V21.1357H56.0963V15.2128H61.8859V13.4192H53.9453V30.7529V30.755ZM69.3624 18.2021C69.3624 20.1029 68.1333 21.1625 66.7367 21.1625H64.893V15.2128H66.7092C68.1333 15.2128 69.3624 16.3261 69.3624 18.2021ZM71.5134 18.1753C71.5134 15.2128 69.3348 13.4213 67.0164 13.4213H62.7993V30.755H64.893V22.9313H66.7092L71.5112 30.755H73.997L68.8601 22.4695C70.369 21.8717 71.5134 20.3502 71.5134 18.1773' fill='%23231F20'/%3E %3C/g%3E %3C/g%3E %3C/g%3E %3Cg id='Group_2'%3E %3Cpath id='Vector_3' d='M9.67285 8.56629V3.50513H12.6249V4.11535H10.5947V5.71719H12.2943V6.32742H10.5947V7.954H12.9046V8.56423H9.67285V8.56629Z' fill='%23231F20'/%3E %3Cpath id='Vector_4' d='M17.6819 8.6137H17.2581L15.1855 3.50513H16.1392L17.0822 5.86975C17.2178 6.20991 17.362 6.63872 17.4976 7.05103H17.5188C17.6544 6.64696 17.7879 6.2264 17.9341 5.86975L18.8666 3.50513H19.7482L17.6862 8.6137H17.6819Z' fill='%23231F20'/%3E %3Cpath id='Vector_5' d='M22.4072 8.56629V3.50513H25.3593V4.11535H23.3291V5.71719H25.0287V6.32742H23.3291V7.954H25.639V8.56423H22.4072V8.56629Z' fill='%23231F20'/%3E %3Cpath id='Vector_6' d='M31.6164 8.56629L29.9698 6.32123H29.2959V8.56629H28.374V3.50513H30.0948C30.9552 3.50513 31.805 4.01227 31.805 4.90906C31.805 5.54402 31.3896 5.97283 30.8725 6.16249L32.6654 8.56629H31.6185H31.6164ZM29.9592 4.10711H29.2959V5.71719H29.9592C30.436 5.71719 30.8704 5.43888 30.8704 4.90906C30.8704 4.37923 30.436 4.10711 29.9592 4.10711Z' fill='%23231F20'/%3E %3Cpath id='Vector_7' d='M37.5849 6.27382V8.56629H36.6737V6.28206L34.6943 3.50513H35.667L36.6503 4.90081C36.8156 5.13789 37.0021 5.38528 37.1378 5.59968H37.159C37.3031 5.39353 37.5001 5.11522 37.657 4.90081L38.6403 3.50513H39.5621L37.5828 6.27382H37.5849Z' fill='%23231F20'/%3E %3Cpath id='Vector_8' d='M44.3084 4.11535V8.56629H43.376V4.11535H41.7188V3.50513H45.9656V4.11535H44.3084Z' fill='%23231F20'/%3E %3Cpath id='Vector_9' d='M52.0484 8.56629V6.32948H49.499V8.56629H48.5771V3.50513H49.499V5.71926H52.0484V3.50513H52.9808V8.56629H52.0484Z' fill='%23231F20'/%3E %3Cpath id='Vector_10' d='M56.2129 8.56629V3.50513H57.1453V8.56629H56.2129Z' fill='%23231F20'/%3E %3Cpath id='Vector_11' d='M64.7402 8.64463L62.4091 6.17693C62.0467 5.79553 61.6208 5.31106 61.2796 4.91524L61.2584 4.92349C61.2796 5.3523 61.2902 5.7811 61.2902 6.13776V8.56629H60.3789V3.50513H61.0316L63.1868 5.82233C63.4878 6.14806 63.9222 6.63872 64.2337 7.00362L64.2549 6.99537C64.2337 6.62223 64.2231 6.17899 64.2231 5.83677V3.50513H65.1344V8.64669H64.7402V8.64463Z' fill='%23231F20'/%3E %3Cpath id='Vector_12' d='M70.9048 8.64416C69.4235 8.64416 68.0566 7.69172 68.0566 6.03421C68.0566 4.37671 69.4659 3.41602 70.8752 3.41602C71.5999 3.41602 72.17 3.57476 72.5324 3.78091L72.3883 4.42412C72.0471 4.21797 71.5491 4.05098 71.0002 4.05098C69.9639 4.05098 68.9912 4.77253 68.9912 6.04246C68.9912 7.31239 69.9448 8.01745 70.9599 8.01745C71.405 8.01745 71.7567 7.93911 71.975 7.7948V6.61352H70.8349V6.03421H72.8354V8.12877C72.3586 8.47718 71.7271 8.64416 70.9091 8.64416H70.9048Z' fill='%23231F20'/%3E %3C/g%3E %3Cpath id='Vector_13' d='M0.0839844 1.00212L73.997 1' stroke='%23231F20' stroke-width='1.25' stroke-miterlimit='10'/%3E %3Cpath id='Vector_14' d='M0.0839844 10.9116H73.997' stroke='%23231F20' stroke-width='1.25' stroke-miterlimit='10'/%3E %3Cpath id='Vector_15' d='M4.91016 4.15649L3.55812 4.13794L5.18777 5.7068L0 5.6532V6.5974L5.20049 6.651L3.61321 8.18068L4.96526 8.19718L7.0018 6.20157L4.91016 4.15649Z' fill='%23D71920'/%3E %3C/g%3E %3C/svg%3E)
